Multi-stakeholder Advisory Group Analysis
The researcher has collected the data from the lists of members available in the public domain from 2010-2015. The lists prior to 2010 have been procured by the Centre for Internet and society from the UN Secretariat of the Internet Governance Forum (IGF).
This research is based solely upon the members and the nature of their stake holding has been analysed in the light of MAG terms of reference. No data has been made available regarding the nomination process and the criteria on which a particular member has been re-elected to the MAG (The IGF Secretariat does not share this data).
According to the analysis, in these six years, the MAG has had around 182 members from various stakeholder groups.
We have divided it into five stakeholder groups, Government, Civil Society, Industry, Technical Community and Academia. Any overlap between two or more of these groups has also been taken into account, for example- A member of the Internet Society (ISOC) being both in the Civil Society and Technical Community.
According to the MAG Terms of Reference[1], it is the prerogative of the UN Secretary General to select MAG Members. The general policy is that the MAG members are appointed for a period of one year, which is automatically renewed for 2 more years consecutively depending on their engagement in MAG activities.
There is also a policy of rotating off 1/3rd members of MAG every year for diversity and taking new viewpoints in consideration. There is also an exceptional circumstance where a person might continue beyond three years in case there is a lack of candidates fitting the desired area.
However, it seems like the exception has become the norm as a whopping number of members have continued beyond 3 years, ranging from 4 years up to as long as 8 years, this figure rounds up to around 49. No doubt some of them are exceptional talents and difficult to replace. However, the lack of transparency in the nomination system makes it difficult to determine the basis on which these people continued beyond the usual term.
|
S. No. |
Stakeholder |
Number of years |
Total Members continuing beyond 3 years |
|
1 |
Civil Society |
8, 6, 6, 4, 4, |
5 |
|
2 |
Government/Industry |
4, 5 |
2 |
|
3 |
Technical community/ Civil society |
8, 8, 8, 6, 6, 4, 4, 4, 4,4 |
10 |
|
4 |
Industry/ Civil society |
8, 6, |
2 |
|
5 |
Industry |
8, 7, 7, 6, 6, 4, |
6 |
|
6 |
Industry/Tech Community/ Civil Society |
8, |
1 |
|
7 |
Government |
7, 7, 7, 6, 6, 6, 6, 5, 5, 5, 5, 5, 5, 4, 4, 4, 4, 4, 4, |
19 |
|
8 |
Academia |
6, 6, 5, |
3 |
|
9 |
Industry/ Tech community |
6, |
1 |
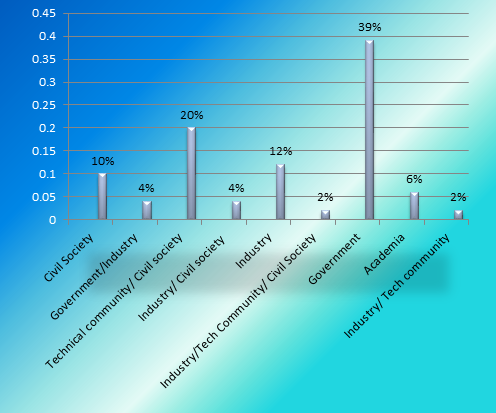
The stakeholders that have continued beyond 8 years have around 39% members from Government and related agencies. The next being Technical Community/Civil Society with around 20% representation, followed by Industry at 12%, 10% from the Civil Society, 6% from Academia, 4% from Government/Industry, 4% from Industry/Civil Society and 2% each from Industry/Technical Community and Industry/Technical Community/Civil Society respectively.
|
|
|---|
Table with overlapping interests merged
|
S. No. |
Stakeholder |
Total Members continuing beyond 3 years |
|
1 |
Civil Society |
7 + 9 + 1+1 = 18 |
|
2 |
Government |
19 |
|
3 |
Tech Community |
9 + 1 + 1+1 = 12 |
|
4 |
Industry |
6 + 2 + 1 + 1+2 = 13 |
|
5 |
Academia |
3 |
When the overlap is grouped separately, as in if a Technical Community/Civil Society person is placed both in Technical Community and Civil Society groups individually, then the representation of stakeholder representation is as follows(approximate values)-
Government- 29%
Civil Society- 28%
Industry- 20%
Technical Community-17%
Academia-5%
This clearly shows us that stakeholders from academia generally did not stay on MAG beyond 3 years. Even when all members that have ever been on MAG are taken into consideration, only around 8% representation has been from the academic community. This needs to be taken into account when new MAG members are selected in 2016.
The researcher has also looked at the MAG Representation based on gender and UN Regional Groups. The results of the analysis were as follows-
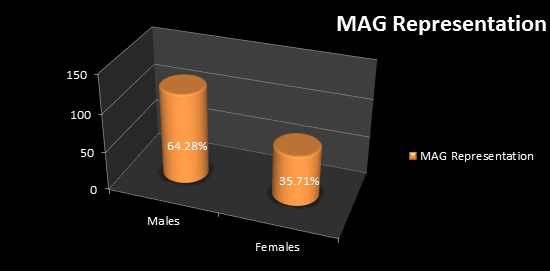
The ratio of male members is to female members is approximately 16:9 in the MAG and the approximate value in percentage being 64% and 36% respectively.
|
|
|---|
Now coming to the UN Regional Groups, the results that the analysis yielded were as follows-
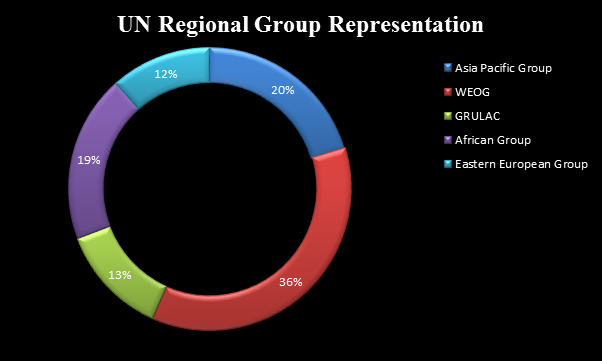
The Western European and Others Group (WEOG) has the highest representation in MAG, a large number of members being from Switzerland, USA and UK. This is followed by the Asia Pacific Group which has 20% representation. The third largest is the African group with 19% representation followed by Latin American and Caribbean Group (GRULAC) and Eastern European Group with 13% and 12% representation respectively.
 |
|---|
The representation of developed, developing and Least Developed Countries is as follows-
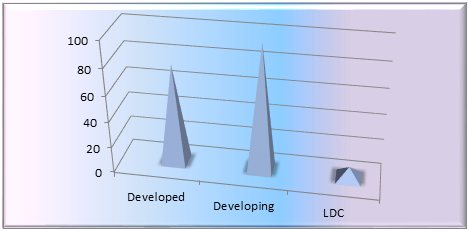
Developed countries have approximately 42% representation, developing countries having 53% and LDCs having a mere 5% representation. There should be some effort to strive for better LDC representation as they are the most backward when it comes to Global ICT Penetration. [2]

[1] Intgovforum.org, 'MAG Terms Of Reference' (2015) <http://www.intgovforum.org/cms/175-igf-2015/2041-mag-terms-of-reference> accessed 13 July 2015.
[2] ICT Facts And Figures (1st edn, International Telecommunication Union 2015) <http://www.itu.int/en/ITU-D/Statistics/Documents/facts/ICTFactsFigures2015.pdf> accessed 11 July 2015.


