Market Structure in the Telecom Industry
Teledensity
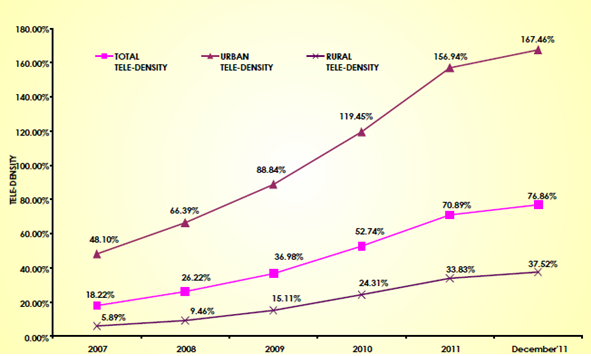
Teledensity means number of telephones per hundred people. The current teledensity in India is 78.10. However, there is a large disparity between urban teledensity and rural teledensity. The urban teledensity stands at 169.37 whereas rural teledensity is 38.53 only. The reason for the slow growth in teledensity in the rural areas is that it is less attractive for the telecom service providers to invest. Furthermore, providing service in the remote and rural areas also requires massive investment.
| Teledensity in India (Rural, Urban and Cumulative) 2007 – December, 2011 |
 |
|---|
| Source: Department of Telecommunication, Annual Report 2011-2012 |
Public and Private Share in the Market
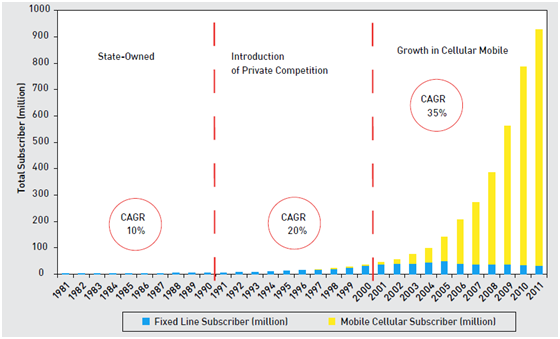
Annual Growth Rate in the Telecom Industry (1981 to December, 2011)
 |
|---|
| CAGR: Compounded Annual Growth Rate Source: TRAI, Telecom Sector in India: A Decadal Profile |
After the Government of India gave up its monopoly in the telecom sector in 1992 the growth of the telecom industry was slow due to lack of roust policy. However, with the change in the policy and licensing regime in the 1999, it is evident from the above graph that the telecom industry recorded a phenomenal growth. There was 35 per cent growth in the compounded annual growth rate.
Wireless
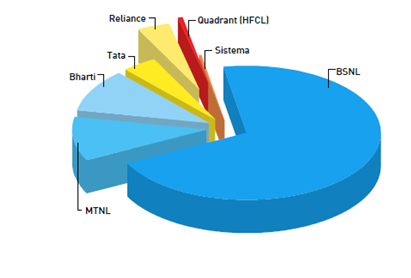
Market share in the wireless subscription as on February, 2012
 |
The pie chart clearly shows that currently the private sector dominates the cellular market. However, this was not the case in the beginning. The changes in the market structure were due to the changes in telecom policy in 1999. The growth rate of number of wireless subscribers from 1996-2011 in the graph below, clearly depicts the growth in wireless subscribers after the change in policy in 1999. Currently, the three main players in the mobile services sector are Vodafone, Reliance and Bharti. |
|---|
Wireline
Market share in the wireline subscription as on December, 2011
| In the basic telecom services or wireline services the incumbent — Bharat Sanchar Nigam Limited (BSNL) has the majority share in the market. This is due to the expanse of the infrastructure available to the incumbent, and its ability to provide basic telecom services in the rural and remote areas. The private wireline service providers do not have the capital to invest in building such infrastructure and there is no profit in such capital investment as well. Therefore, the private players mainly concentrate in urban areas where they can earn more revenue. |  |
|---|
Internet Services
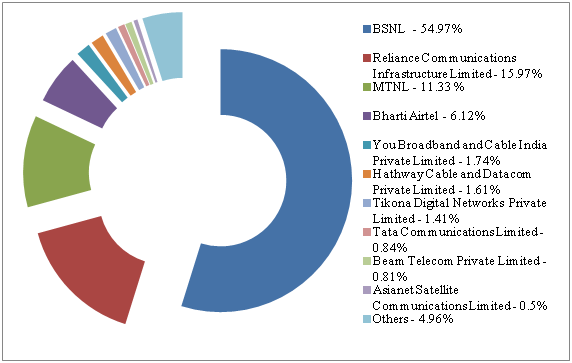
Market share of ISPs as on December, 2011
 |
|---|
| Source: TRAI, Telecom Sector in India: A Decadal Profile |
The broadband services came into forefront after the implementation of the Broadband Policy, 2004. It laid down that the minimum speed for a broadband connection has to be 256 kilo bits per second. This has been revised to 512 kilo bits per second under the National Telecom Policy, 2012. In India, 59.6 per cent internet subscription is broadband subscription.
Currently, the main technology used for broadband access is digital subscriber line (DSL). About 85.1 per cent of the broadband subscriptions are via DSL technology. While the other technologies such as fibre, leased line, wireless, ethernet, cable modem covers only 14.9 per cent of the market. The main internet service provider (ISP) in the market is BSNL which has a share of 54.97 per cent.


